

Headline — operational GW now
As of June 6, 2026, the best current single estimate for operational data-center capacity in transparent markets excluding China, Russia and other opaque states remains about 60 GW of live IT-load capacity, using Knight Frank's 2026 live IT-capacity table as the cleanest internally consistent global/regional public series. This must be read as a tracked-market proxy for transparent markets, not an audited ex-CRO census: Knight Frank's public table does not explicitly prove that every opaque market is removed from the aggregate.
A new cross-check from CEPR/VoxEU using BNEF data says global live IT capacity exceeded 55 GW by Q2 2025, with the US at roughly 50%, Europe at 18% and China at 10%. Using the 55 GW floor and subtracting China gives a 49.5 GW ex-China live IT-load floor before any Russia/opaque-state adjustment. That supports the broad 50-60 GW live-capacity area but also shows why a 25% China haircut is conservative for live IT capacity.
The defensible bracket is roughly 45-77 GW, but it is a cross-definition bracket rather than a statistical confidence interval. The low side is McKinsey's 2024 60 GW global capacity-demand estimate after a 25% China subtraction. The high side is JLL's 103 GW global 2025 broad capacity estimate after the same China proxy; JLL's number is broader because it includes colocation, build-to-suit, hyperscale owner-occupied and on-prem capacity.
The headline basis is IT load. Facility power and grid demand are larger and are not averaged into the live-capacity estimate. Grid-demand sources such as IEA, LBNL, EPRI, AEP, Oncor, Georgia Power and utility filings are pressure checks, not direct capacity replacements.
How fast it's going up
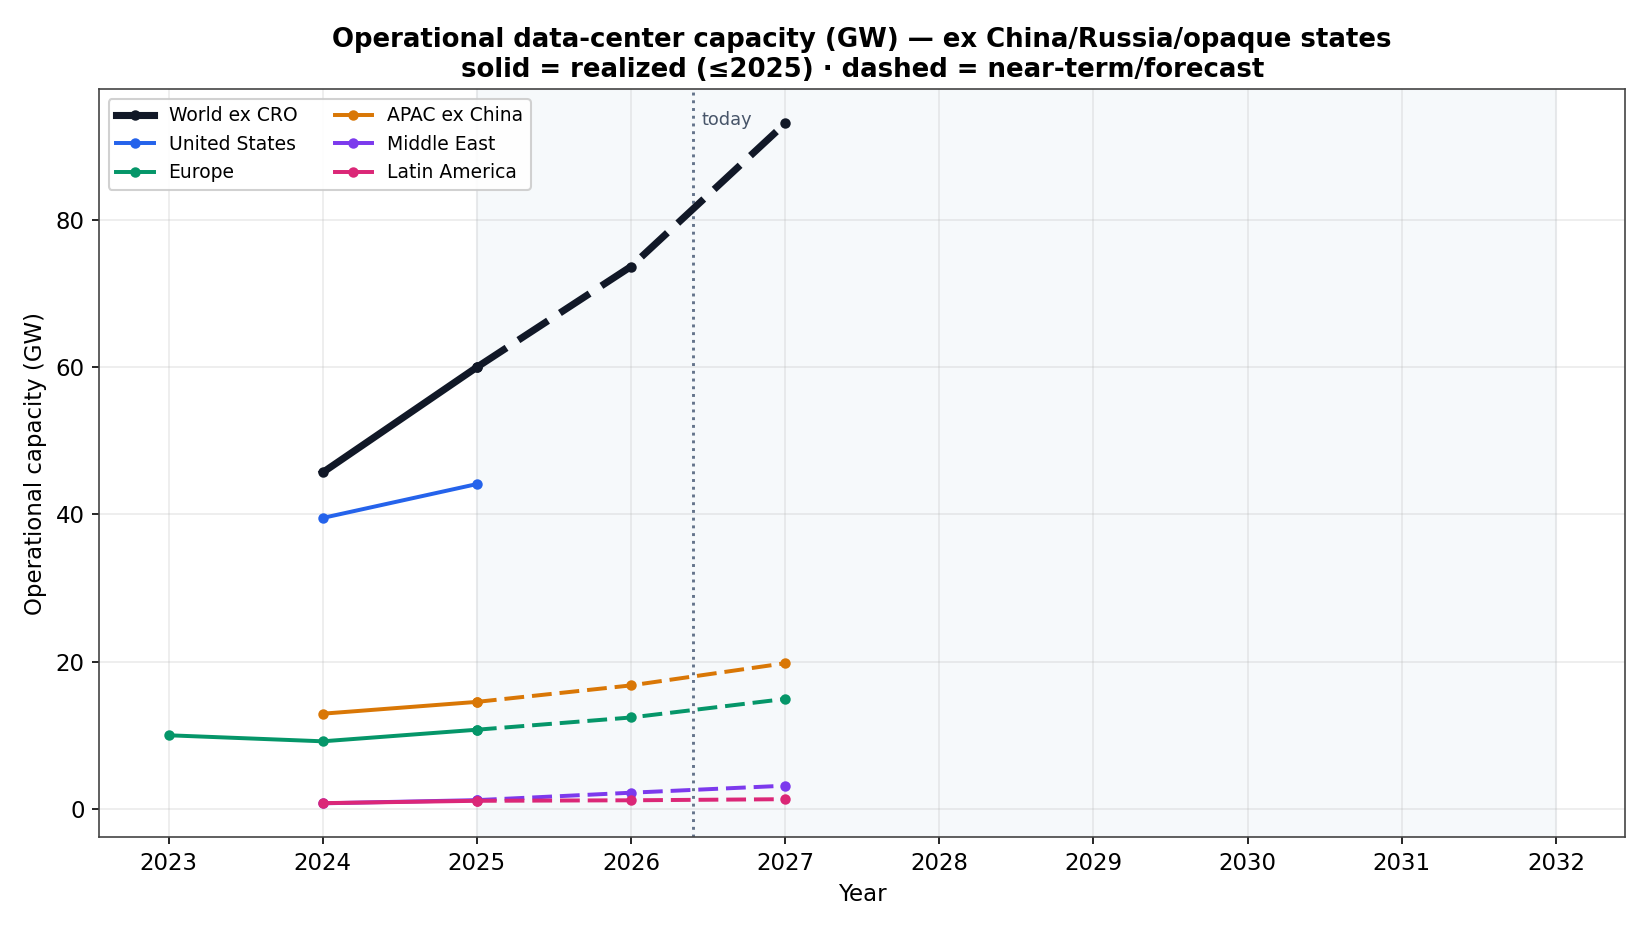
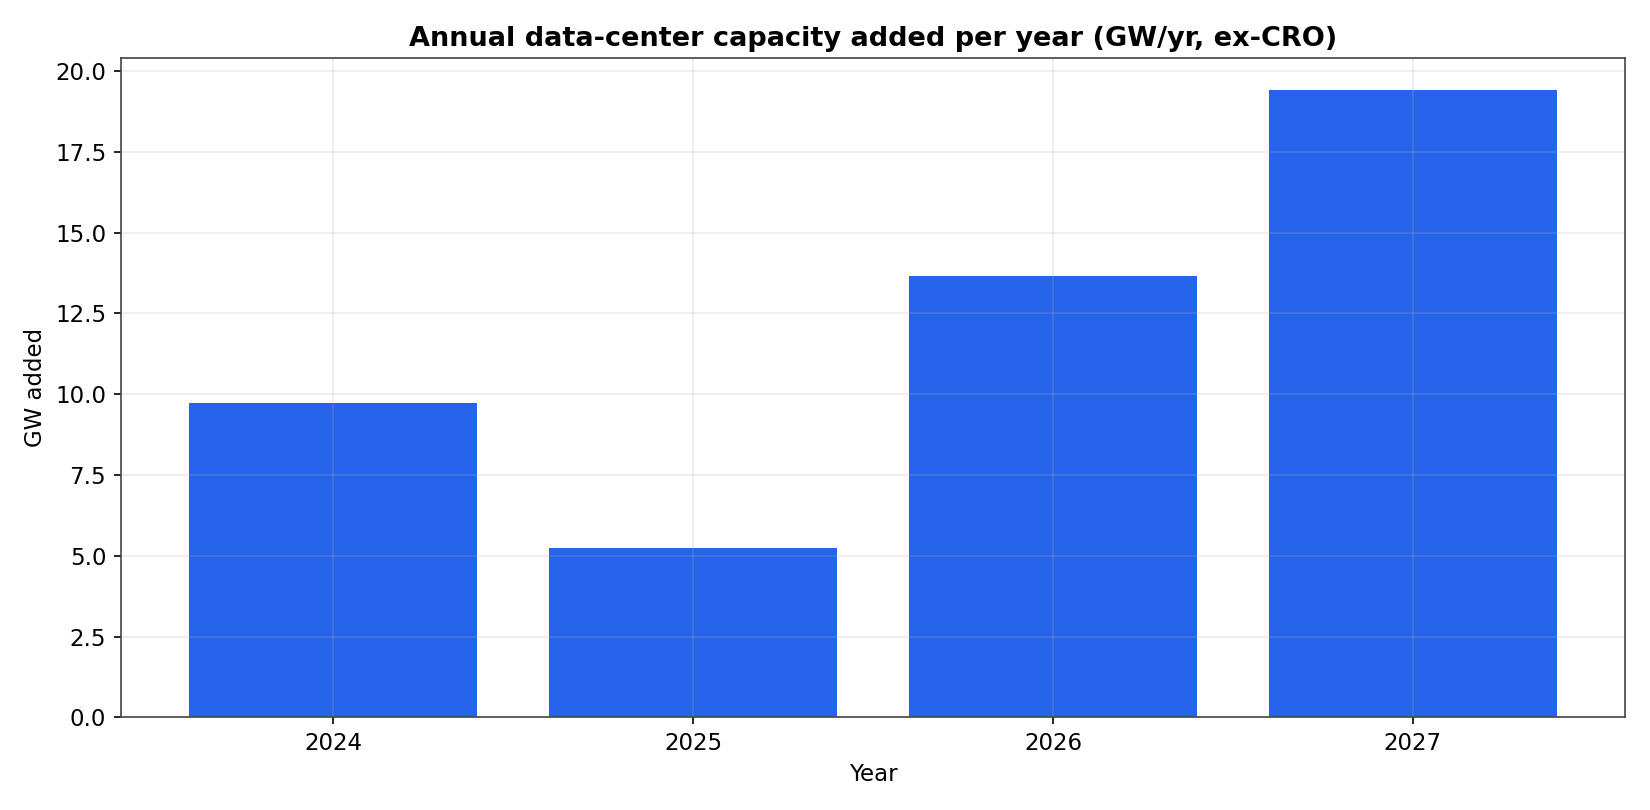
The promoted live IT-load series in data/timeseries.json uses the Knight Frank curve: 45.676 GW in 2024 from Knight Frank 2025, then 59.962 GW in 2025, 73.631 GW in 2026 and 93.052 GW in 2027 from Knight Frank 2026. The latest 2025-2027 curve implies net additions of 13.669 GW in 2026 and 19.421 GW in 2027, a 24.6% 2025-2027 CAGR and a doubling time of about 3.2 years if that near-term pace held.
The same-publisher revision is now clearer. Knight Frank's 2025 report forecast 55.646 GW of global live IT capacity in 2025 and 66.504 GW in 2026; the 2026 report lifted those to 59.962 GW and 73.631 GW. That is a +4.316 GW revision for 2025 and a +7.127 GW, +10.7% revision for 2026 on the same live IT-capacity basis.
JLL's broader supply curve gives the cleanest full 2030 view. JLL estimates global capacity at 103 GW in 2025 and 200 GW in 2030, with 97 GW added from 2026 through 2030 and a 14% supply CAGR. Using the 25% China subtraction, that is 77.25 GW ex-China proxy in 2025 and 150 GW in 2030. That broader curve implies a doubling time around 5.3 years, slower than the Knight Frank 2025-2027 live-capacity burst but still very fast for power-intensive infrastructure.
The United States remains the largest acceleration point. Goldman Sachs reports realized US data-center capacity activations of 6.4 GW in 2024 and 8.5 GW in 2025, with scheduled activations rising to 13.6 GW in 2026 and 36.3 GW in 2027 before delay and cancellation risk. Goldman separately forecasts US data-center power demand of 31 GW in 2025, 41 GW in 2026 and 66 GW in 2027.
EPRI's 2026 dashboard adds a useful basis split for the US 2030 view: its medium scenario has 87.4 GW of nominal IT capacity, 70.7 GW of peak data-center load and 596 TWh of annual energy use, equal to 68.0 GW on an average-grid-demand basis. EPRI says the 2026 projection is about 60% higher than its 2024 study, which is a cleaner same-publisher revision signal than most cross-forecaster comparisons.
JLL's North America figures show both real growth and methodology expansion. JLL Midyear 2025 reported 15.5 GW of North American colocation inventory, 1.6 GW of H1 2025 completions, 7.8 GW under construction and a possible 42 GW colocation market by 2030. JLL Year-end 2025 then expanded hyperscale and frontier-market coverage and reported 39 GW of active North American capacity. That is not a clean same-basis jump; it is a reminder that source coverage can move the apparent market size.
Canada is now better anchored. DC Byte as reported by DCD puts Canada live IT capacity at 1.4 GW in Q2 2025, with roughly 9 GW in non-live development stages and 6.9 GW of that early stage. AESO separately shows 11.834 GW of Alberta data-center connection applications over 10 MW, mostly in Calgary and Edmonton. That is grid-request pressure, not live capacity.
Europe is growing more steadily. CBRE Europe says European markets delivered 655 MW in 2024 and expected 937 MW in 2025; its Q1 2026 figures forecast 713 MW of 2026 top-15 European colocation supply. Knight Frank shows Europe live IT capacity rising from 10.755 GW in 2025 to 14.932 GW in 2027.
APAC ex-China remains the hardest region to reconcile, but the transparent-market basket is clearly scaling. Knight Frank's APAC tracked-market series rises from 14.533 GW in 2025 to 19.778 GW in 2027. A Cushman & Wakefield APAC H2 2025 table gives a lower-bound transparent primary-market basket of 6.29 GW operational IT load, 1.992 GW under construction and 8.952 GW planned across Greater Tokyo, Singapore, Sydney, Mumbai, Hong Kong, Johor, Greater Seoul, Greater Jakarta and Bangkok. That is not a full APAC ex-China total, but it makes the country gaps more concrete: Greater Tokyo alone is 1.179 GW live with 1.705 GW planned, while Greater Jakarta and Bangkok remain smaller but have pipelines larger than live stock. India is now a material swing market: Cushman & Wakefield India reports 1.6 GW operational capacity, 3.1 GW under construction and planned, and a further 10.5 GW at land stage, while JLL India puts H1 2025 IT-load inventory at 1.123 GW and forecasts 2.073 GW by end-2027. CBRE says Singapore has two development-capacity tranches totaling 1.2 GW, a larger pipeline marker than the already-live capacity rows. JLL Malaysia figures reported by New Straits Times show Malaysia operational capacity rising from 0.9 GW at end-2025 to 2.055 GW by end-2026, with Johor alone at 0.85 GW operational, 1.8 GW under construction and 2.7 GW planned. ETNews/KDCC says Korea commercial data-center IT power supply surpassed 1 GW in 2025 and could reach 1.569 GW in 2029. Australia remains the cleanest APAC country series: Data Centres Australia/DC Byte has national operational IT load rising from 1.4 GW in 2025 to 3.2 GW in 2030. Japan's total national capacity is still not clean, but an AI-specific check from Impress/Cloud Watch says domestic AI-data-center IT supply power reached 0.3 GW at end-2025 and could exceed 0.6 GW by end-2026.
Latin America is no longer just two city anchors. DCD's coverage of the JLL Latin America report reports 1.105 GW of installed regional capacity at end-2025 and 184 MW of 2025 colocation deliveries. Forbes Brasil citing JLL reports 683 MW under construction and a pipeline above 3.8 GW. Brazil accounts for 48% of operational regional capacity and 71% of capacity under construction.
Africa is now explicit rather than absent, but it is still small in the global capacity stack. ADCA's 2026 Africa economic report says Africa has 360 MW active capacity, 238 MW under construction and 656 MW planned, equal to only 0.6% of global capacity. South Africa is the main anchor: the DBSA digital infrastructure study puts South African data-center IT-load capacity at 435 MW in 2024, rising to 829 MW in 2029. Nigeria is the next useful West Africa marker: the D4D Hub/Xalam Nigeria brief estimates roughly 28 MW of live commercial IT load in 2025E and 80 MW of potential full-build IT load.
Forecast vs expected vs current forecast
The central result remains that expectations are being revised upward, but the cleanest revisions are not always the biggest headline numbers.
| Target and basis | Earlier / expected | Current / latest | Revision |
|---|---|---|---|
| World_ex_CRO 2026 live IT capacity, same publisher | 66.504 GW from Knight Frank 2025 | 73.631 GW from Knight Frank 2026 | +7.127 GW, +10.7%; clean same-publisher live IT-load revision, but still a tracked-market proxy |
| World_ex_CRO 2030 market capacity, broad/unspecified | 91.5 GW from Goldman Sachs Feb. 2025, using 122 GW global capacity less 25% China | 150.0 GW from JLL Jan. 2026, using 200 GW global broad capacity less 25% China | +58.5 GW, +64%; directionally important but not apples-to-apples because JLL is broader |
| World_ex_CRO 2030 Goldman power demand, same publisher | 109.3 GW under Goldman's 165% growth case in Feb. 2025 | 113.4 GW under Goldman's 175% growth case in Dec. 2025 | +4.1 GW, +3.8%; clean same-publisher upward revision |
| US 2028 grid/power demand | LBNL Dec. 2024 low/high average grid demand of 37.1-66.2 GW | Morgan Stanley Mar. 2026 74 GW demand by 2028; S&P/451 Oct. 2025 108 GW facility/grid power by 2028 | Morgan Stanley is +7.8 GW above LBNL's high case; S&P is higher but on facility-power basis |
| US 2030 EPRI demand scenarios, same publisher | EPRI May 2024 framed data centers at 4.6%-9.1% of US electricity use by 2030 | EPRI 2026 dashboard has 384-794 TWh of 2030 annual use, 45.4-94.0 GW peak load and 56.1-132.1 GW nominal IT capacity | EPRI says the updated projection is about 60% higher than the 2024 study; clean same-publisher revision, but the old public vintage is percentage-share rather than GW |
| ERCOT 2030 data-center growth, grid demand | 29.614 GW in ERCOT's 2024 forecast | 77.965 GW in ERCOT's 2025 forecast from ERCOT's 2025 long-term load forecast update | +48.351 GW, +163%; the sharpest regional forecast-reset example |
| AEP 2030 signed large-load additions, grid demand | 56 GW in AEP's March 2026 investor handout, with 88% data centers and crypto | 63 GW on AEP's current investor page | +7 GW, +12.5%; clean same-publisher signed-load revision, but the June page does not restate data-center split |
| Georgia Power mid-2030s economic-development pipeline, grid demand | 69.1 GW in Q4 2025, restated in Georgia Power's Q1 2026 large-load report | 76.2 GW in Q1 2026, including 73.1 GW of large-load economic-development projects | +7.1 GW, +10.3%; same-utility pipeline revision, but not all data centers and not committed load |
| Malaysia operational capacity, unspecified basis | 0.9 GW at end-2025 from JLL Malaysia as reported by New Straits Times | 2.055 GW forecast by end-2026 | +1.155 GW, +128%; country-level APAC acceleration example |
The AEP example is useful because it sits between speculative queues and completed capacity. In March 2026 AEP showed 56 GW of cumulative contracted load additions by 2030, backed by ESAs or LOAs, with 36 GW in ERCOT, 15 GW in PJM and 5 GW in SPP. Its current investor page now states 63 GW of new load by 2030 backed by signed agreements. This is not all data centers, but the March deck's 88% data-center/crypto share makes it a material signed-load signal. Georgia Power is one step looser than AEP because its public report redacts project identities and mixes large-load economic development with other load, but the 12.4 GW of committed large-load customers and 8.5 GW already broken ground are harder evidence than a raw inquiry queue.
The cross-publisher global revision remains less clean. Goldman, JLL, McKinsey, Knight Frank and IEA are not measuring the same object. The right reading is: every major public view now points upward, but only same-publisher and same-basis pairs should be treated as true forecast revisions.
Under construction & planned pipeline
The build queue is much larger than live stock, but the queue has layers: under construction, contracted or committed, planned, early stage and raw grid requests should not be summed.
The strongest disclosed construction figure is North America. JLL North America year-end 2025 says more than 35 GW is under construction, with 92% precommitted or owner-occupied and 64% in frontier markets. That implies at least 32.2 GW of precommitted or owner-occupied capacity under construction and at least 22.4 GW in frontier markets, using JLL's stated percentages on the 35 GW lower bound. JLL's year-end newsroom release also says it now tracks 39 GW of active North American capacity after expanding hyperscale and frontier-market coverage, and that Texas alone has 6.5 GW under construction.
That JLL number is not the same object as earlier colocation-only trackers. JLL Midyear 2025 reported 15.5 GW of North American colocation inventory, 7.8 GW under construction and 31.6 GW planned, with the colocation market potentially expanding to 42 GW by 2030. The year-end 39 GW active-capacity figure is broader because it adds hyperscaler-owned and expanded frontier-market coverage.
Cushman & Wakefield's 2026 Global Data Center Market Comparison release gives the largest regional pipeline figures: Americas operational capacity of 43.4 GW, 25.3 GW under construction and 191.3 GW in pipeline; EMEA operational capacity of 11.4 GW, 2.7 GW under construction and 12.1 GW planned. DataCenterDynamics reports the same Cushman global under-construction headline at 31.7 GW, with roughly 80% in the Americas.
Canada adds another North American pipeline layer. DC Byte/DCD reports 1.4 GW live capacity but 10.3 GW total tracked IT capacity, meaning roughly 9 GW is non-live pipeline. AESO's Alberta connection applications sum to 11.834 GW, led by 3.533 GW in Calgary and 3.161 GW in Edmonton. The Alberta figure is grid-demand queue pressure rather than data-center capacity and should be haircut heavily unless projects secure power, site control, commercial terms and construction progress.
ERCOT is the clearest example of grid-load forecasts moving faster than deliverable capacity. ERCOT's 2025 long-term load forecast update says 2030 data-center growth rose from 29.614 GW in the 2024 forecast to 77.965 GW in the 2025 forecast. That is grid-demand growth, not operational capacity, and it should sit beside AEP, AESO and Dominion as pressure evidence rather than be summed with construction pipelines.
Two additional US utility disclosures show the load-pressure problem is broader than Virginia and AEP. Oncor says its active transmission LC&I interconnection queue included about 271 GW from data centers at the end of Q1 2026, and that it submitted 122 GW of large-load forecast data through 2036 for ERCOT's 2026 Regional Transmission Plan. Georgia Power's Q1 2026 large-load report shows 12.4 GW of committed large-load customers, 8.5 GW of that already broken ground, 7.8 GW of near-term committed load by winter 2028/2029 and a 73.1 GW large-load economic-development pipeline through the mid-2030s. These are not data-center capacity numbers; they are a screening stack for grid stress and execution risk.
In APAC, Johor has become one of the most important new power-advantaged clusters. JLL Malaysia says Johor has 0.85 GW operational, 1.8 GW under construction and 2.7 GW planned, while Greater Kuala Lumpur has 0.182 GW operational, 0.615 GW under construction and 0.785 GW planned. Cushman & Wakefield reports a record 19.4 GW APAC development pipeline in 2025. The transparent primary-market rows I can use directly sum to 6.29 GW operational, 1.992 GW under construction and 8.952 GW planned across Greater Tokyo, Singapore, Sydney, Mumbai, Hong Kong, Johor, Greater Seoul, Greater Jakarta and Bangkok. India adds 1.6 GW operational and 3.1 GW under construction/planned from Cushman, while CBRE puts Singapore's new development-capacity tranches at 1.2 GW. CBRE APAC 2026 separately highlights the shift toward Malaysia, India and Australia as power availability reshapes where capacity can land.
Latin America has 1.105 GW installed, 0.683 GW under construction and more than 3.8 GW in pipeline. Brazil dominates the construction layer, but the JLL/DCD hub data show more distributed growth: Sao Paulo/Barueri at 236 MW, Queretaro at 221 MW, Campinas at 181 MW, Santiago at 166 MW and Rio de Janeiro at 71 MW.
Africa has 0.36 GW active, 0.238 GW under construction and 0.656 GW planned from ADCA. The South Africa-specific data are cleaner on IT-load basis: DBSA cites 0.435 GW in 2024 and 0.829 GW in 2029, with about 0.300 GW of infrastructure being built. Nigeria remains much smaller at about 0.028 GW live commercial IT load, but its 0.080 GW full-build potential shows residual shell/power capacity that still needs capital before it becomes live.
In the Middle East, JLL EMEA reports 1 GW operational across nine metros, 2.2 GW under construction and 12 GW planned. Riyadh alone has 1.4 GW under construction and a further 5.2 GW planned, while JLL has 602 MW across Abu Dhabi and Dubai. Saudi Arabia now has a cleaner national current-capacity anchor: Saudi Press Agency says operational data-center capacity rose from 68 MW in 2021 to more than 440 MW in 2025 and 467 MW in Q1 2026. A cleaner UAE live-capacity cross-check from Knight Frank's EMEA report is lower at 376 MW live IT capacity, with 19.2 MW added in 2025. The Gulf pipeline is large but lumpy: Knight Frank's 2026 project table lists Stargate Abu Dhabi at 1 GW with 200 MW due in September 2026 and HUMAIN SPARK in Saudi Arabia at 300 MW scalable to 1.2 GW, with HUMAIN aiming for 1.9 GW by 2030 and 6.6 GW by 2034. Saudi Vision 2030's HUMAIN page states a 1.8 GW 2030 target, so the 1.8-1.9 GW 2030 Saudi target should be treated as a rounded target range rather than a precise discrepancy. Qatar remains small in disclosed live capacity: World Bank cites 23.5 MW, and DCD's Ooredoo/Syntys coverage puts Syntys live IT capacity at 26 MW. Bahrain has a low-confidence 70 MW operational AI-capacity marker from AI Data Center Index and a Bahrain EDB stc campus with potential capacity up to 60 MW.
The risk filter is construction status. Sightline Climate tracks 190 GW across 777 large data centers and AI factories announced since 2024 and says at least 16 GW is slated to come online in 2026, but only about 5 GW of that 2026 slate was under construction. The remaining roughly 11 GW had no visible construction progress.
Where it's happening
| Region | Current operational capacity | Under construction / planned | What matters |
|---|---|---|---|
| United States / North America | US nominal IT-load range is 35-44 GW in 2024 from EPRI; CEPR/BNEF implies at least 27.5 GW of US live IT capacity using its 55 GW global floor and 50% US share; Knight Frank North America live IT capacity is 32.203 GW; JLL tracks 39 GW of expanded active North American capacity | JLL North America has >35 GW under construction; Texas alone has 6.5 GW under construction; AEP has 56 GW contracted load additions by 2030 in March and 63 GW on its current investor page; Canada has 1.4 GW live and roughly 9 GW non-live pipeline | Power access and signed-load quality are the bottlenecks; Dominion's 30.132 GW ELOA queue, Oncor's 271 GW active data-center request queue, Georgia Power's 12.4 GW committed large-load customers and 73.1 GW large-load pipeline, AESO's 11.834 GW Alberta requests, ERCOT's 77.965 GW 2030 data-center-growth forecast and AEP's signed-load disclosures are pressure signals rather than live capacity |
| Europe / EMEA | CEPR/BNEF implies at least 9.9 GW using its 55 GW global floor and 18% Europe share; Knight Frank Europe live IT capacity is 10.755 GW in 2025; CBRE Q1 2026 top-15 colocation supply is 5.709 GW | Cushman: 2.7 GW under construction and 12.1 GW planned in EMEA; CBRE: 713 MW 2026F top-15 new supply | Mature FLAP-D markets are constrained by power, land and permitting; secondary markets gain share |
| APAC ex-China | Knight Frank tracked-market APAC is 14.533 GW in 2025; Australia is 1.4 GW IT load; India is 1.123 GW IT load from JLL H1 2025 or 1.6 GW broader operational capacity from Cushman; Malaysia is 0.9 GW operational at end-2025; Korea commercial IT power surpassed 1 GW in 2025; Cushman's lower-bound transparent primary-market basket is 6.29 GW; Japan AI-specific IT supply power is 0.3 GW | Cushman's same basket has 1.992 GW under construction and 8.952 GW planned; India has 3.1 GW under construction/planned plus 10.5 GW at land stage; Singapore has 1.2 GW development capacity from CBRE; Malaysia is forecast to reach 2.055 GW by end-2026; Johor has 1.8 GW under construction and 2.7 GW planned; Australia has 3.1 GW committed and 16.8 GW early stage | Johor/Malaysia, India and Australia are power-advantaged growth centers; Greater Tokyo is still the largest transparent APAC city row but constrained; Singapore and Hong Kong are large but land/power-limited; Indonesia and Thailand have small live bases but large planned pipelines |
| Middle East | JLL EMEA has 1 GW across nine metros; Knight Frank has 1.195 GW live IT capacity in 2025; Saudi Arabia is 467 MW operational in Q1 2026 from SPA; UAE live IT capacity is 376 MW from Knight Frank versus 602 MW total Abu Dhabi plus Dubai capacity from JLL; Qatar is 23.5-26 MW live; Bahrain has a low-confidence 70 MW AI-capacity marker | JLL has 2.2 GW under construction and 12 GW planned; Riyadh has 1.4 GW under construction and 5.2 GW planned; Stargate Abu Dhabi is 1 GW with 200 MW due in 2026; HUMAIN SPARK is 300 MW scalable to 1.2 GW; HUMAIN targets roughly 1.8-1.9 GW by 2030 | Gulf sovereign AI and cloud localization are turning the region from small base to high-growth pipeline, but the biggest numbers are project targets or planned capacity rather than current stock |
| Latin America | JLL/DCD reports 1.105 GW installed at end-2025; Brazil is about 48% of the operational regional stock; Chile is 166 MW | Forbes/JLL reports 683 MW under construction and more than 3.8 GW in pipeline; Brazil is 71% of construction; Queretaro and Santiago are major non-Brazil anchors | Brazil leads, but Mexico, Chile and Colombia are making the regional buildout less concentrated; power transmission and tax/regulatory regimes are key constraints |
| Africa / South Africa / Nigeria | ADCA reports 360 MW active capacity across Africa; DBSA puts South Africa IT-load capacity at 435 MW in 2024; D4D Hub/Xalam puts Nigeria commercial live IT load at about 28 MW in 2025E | ADCA has 238 MW under construction and 656 MW planned across Africa; DBSA cites 300 MW of South African infrastructure being built and 829 MW South Africa IT load by 2029; Nigeria potential full-build commercial IT load is 80 MW | Africa is in scope but too small to move the global headline. South Africa dominates the continent, while Nigeria is the key West Africa marker; power reliability, transmission and low occupancy are larger constraints than land alone |
What's driving it / what could slow it
The demand driver is still hyperscale and AI, but the decisive near-term variable is deliverable power. JLL 2026 says the sector may require up to $3 trillion by 2030, split between real-estate asset creation and tenant IT fit-out. JLL also expects AI to move from about one-quarter of workloads in 2025 to about half by 2030, with inference overtaking training as the dominant AI requirement around 2027.
Capacity is also becoming more concentrated. CEPR/VoxEU using BNEF data says facilities above 10 MW are less than 20% of the global facility count but account for more than 80% of global IT capacity, with 16 sites worldwide now above 1 GW of theoretical IT capacity. That makes a small number of power-rich campuses disproportionately important to the capacity curve.
AI changes the physical design envelope. JLL points to rack densities approaching 100 kW and liquid cooling becoming a practical requirement. McKinsey frames 200 MW facilities as normal for the new AI era and says advanced server configurations can require rack densities well above historical norms. That makes old colocation halls less fungible and rewards new AI-ready designs.
Capital is chasing power-secure sites. CBRE APAC 2026 says APAC data-center investment reached $11.6 billion in 2025 and that power availability is reshaping where capacity can be delivered. Morgan Stanley frames the same issue for US energy markets, with demand rising faster than available power in key regions.
Grid interconnection is the main slowdown. Dominion's Virginia disclosure shows 3.584 GW of 2024 data-center billing demand, 6.992 GW forecast by 2030 and 30.132 GW of contracted ELOA pipeline. AEP's latest 63 GW signed-load disclosure, Oncor's 271 GW active data-center transmission request queue, Georgia Power's 12.4 GW committed large-load customers and 73.1 GW large-load pipeline, AESO's 11.834 GW Alberta request queue and ERCOT's 77.965 GW 2030 data-center-growth forecast show that this is no longer just a Northern Virginia story. EIA shows the load growth already visible in Virginia commercial electricity sales and PJM load forecasting.
Equipment and construction are the second bottleneck. Transformers, switchgear, backup generation, gas turbines, power electronics and specialized cooling equipment can have multi-year lead times. A project with land but no firm power and no ordered long-lead electrical equipment should not be treated the same as a pre-leased project already under construction.
Permitting, water and community acceptance are the third bottleneck. Europe and Ireland are clear examples: EirGrid/SONI treats data-center and new-technology loads as a material adequacy-planning category, while CBRE and Cushman both identify power and land constraints in European primary markets. Similar constraints are appearing in US county approvals and utility tariff debates.
Methodology & caveats
This report treats operational IT load as the headline capacity metric. IT load is the power available to servers and networking equipment; it is the closest common language for data-center real-estate capacity. Facility power is larger because it includes cooling, power distribution losses, lighting, pumps and other overhead. Grid demand is energy over time, often reported in TWh/year or average GW, and depends on utilization/load factor as well as PUE.
Classification is explicit. DISCLOSED/measured means a source reports an existing inventory, active capacity, billing demand, delivered supply or under-construction stock. ESTIMATE/forecast means a source projects future capacity, infers current capacity from shares, reports announced/early-stage project queues, or gives scenario demand. The report uses disclosed/measured rows for the central current stock where possible and uses estimates/forecasts for ranges, growth trajectories and pipeline risk.
The operational_capacity metric in data/figures.csv includes rows whose basis is grid_demand, facility_power or unspecified. Those rows are intentionally preserved for auditability, but the basis column controls interpretation. They should not be averaged into the IT-load headline.
No number is converted silently. TWh/year rows in data/figures.csv are converted to average grid-demand GW only as TWh divided by 8.76, and they remain labeled grid_demand. A full conversion from IT-load capacity to annual electricity use would require PUE and utilization assumptions: annual TWh = IT GW x PUE x utilization x 8.76. For sensitivity, a PUE range of 1.3-1.6 and utilization range of 70%-95% is reasonable; Uptime Institute is the main source for PUE context.
Peak-load rows are also not average demand. The new EPRI dashboard rows keep nominal IT capacity, peak load and annual-energy average GW separate because peak load reflects PUE, utilization and ramping rather than a full-year average.
The ex-CRO subtraction is the biggest global caveat. When a source gives only a global total, the datastore uses IEA's 25% China share of 2024 global data-center electricity demand as the default subtraction. Russia and other opaque-state shares are not separately isolated in public capacity data, so the global ex-CRO rows are best described as ex-China proxies with an additional opaque-state caveat. Two capacity-share cross-checks point lower for China: Synergy Research implies roughly 15% of hyperscale critical IT load, and CEPR/VoxEU using BNEF data puts China at roughly 10% of live IT capacity in Q2 2025. That means the IEA 25% haircut is probably conservative for live capacity, but it remains the only broad electricity-demand proxy and still does not quantify Russia or other opaque states.
The Knight Frank promoted series is not a 25% haircut row. It is a tracked-market live IT-load series whose public table does not expose mainland China or Russia rows; the report therefore treats it as a transparent-market proxy while preserving the separate 10%, 15% and 25% China-share cross-checks for global-source sensitivity.
The largest source conflict is definitional. JLL's 2026 103 GW global figure includes colocation, build-to-suit, hyperscale owner-occupied and on-prem capacity; that is why its ex-China proxy is 77.25 GW in 2025. Knight Frank, Goldman, CEPR/BNEF, Cushman and McKinsey cluster closer to 49-60 GW global/live/market capacity before China treatment. The report therefore uses about 60 GW IT-load as the central live-capacity estimate and keeps JLL's broader number as an upper-range broad-supply estimate.
Pipeline figures are not additive. Canada total tracked capacity includes live and non-live phases; Australia total pipeline includes operational capacity; Africa-wide ADCA rows are a mixed-reporting regional stack; Nigeria potential/full-build IT load is not live capacity; ERCOT, Oncor and AESO rows are grid-request or load-forecast queues; AEP and Georgia Power rows are signed or committed large-load evidence but not all data centers; Sightline is an announced-project tracker with uncertain geographic scope; Gulf mega-project rows include targets and phased delivery dates. These are useful for pressure and risk analysis, not for counting operational stock. The working hierarchy is live IT capacity first, under construction second, signed/committed load third, planned/announced capacity fourth and raw grid requests last.
Sources
- 2026 Global Data Center Outlook — JLL
- Energy and AI - Energy demand from AI — IEA
- 2025 Global Data Center Outlook — JLL
- Global Data Center Trends 2025 — CBRE
- North America Data Center Trends H2 2025 — CBRE
- Dallas, Texas Ranked No. 1 Primary Data Market in the World — Cushman & Wakefield
- Global data center capacity under construction reached 31.7GW in 2025 — DataCenterDynamics
- 2025 Global Data Centre Index — DC Byte
- 2026 Long-Term Load Forecast Supplement — PJM
- Dominion Energy Virginia 2025 20-Year Data Center Forecast — Dominion Energy
- Commercial electricity sales have soared in Virginia, driven by data centers — EIA
- Asia Pacific Data Centre Report Year-end 2025 — JLL
- India Data Center Pipeline Reaches 3.1GW — Cushman & Wakefield
- APAC Data Centre Investment Hits Record US$11.6 Billion — CBRE
- EMEA year end data centre report 2025 — JLL
- India Data Centre Market Dynamics Report H1 2025 — JLL
- PJM 2026 load forecast table in FERC EL26-63 filing — FERC/PJM
- US Data Center Power Demand Projected to Double by 2027 — Goldman Sachs
- AI to drive 165% increase in data center power demand by 2030 — Goldman Sachs
- Is There Enough Data Center Capacity for AI — Goldman Sachs
- 2026 Asia Pacific Data Centre Trends and Outlook — CBRE
- Asia Pacific's Data Centre Development Pipeline Hits Record 19.4GW in 2025 — Cushman & Wakefield/APREA
- Korea Data Centre 2H 2025 — Cushman & Wakefield
- Data Centres and the Power Challenge — Cushman & Wakefield
- EMEA Data Centre Update H2 2025 — Cushman & Wakefield
- Global Data Center Market Comparison 2026 Germany release — Cushman & Wakefield
- European Data Centres Outlook 2026 — CBRE
- New Investment in Europe's Data Centre Markets to Hit New Heights in 2025 — CBRE
- Data Centres Global Forecast Report 2026 — Knight Frank
- Powering AI: Markets Race to Invest in AI Energy Solutions — Morgan Stanley
- 2024 United States Data Center Energy Usage Report — Lawrence Berkeley National Laboratory
- Powering Intelligence: Updated US Data Center Scenarios — EPRI
- AI and the Power Grid: Where the Rubber Meets the Road — BloombergNEF
- AI data centers fuel quicker growth in power demand — BloombergNEF
- Uptime Institute Global Data Center Survey 2025 — Uptime Institute
- Building data centers bigger, faster — McKinsey
- AI power: Expanding data center capacity to meet growing demand — McKinsey
- The role of power in unlocking the European AI revolution — McKinsey
- European Data Centres Figures Q1 2026 — CBRE
- North America Data Center Report Year-end 2025 — JLL
- All-Island Resource Adequacy Assessment 2026-2035 — EirGrid/SONI
- Australian Data Centre Forecast Report Issue 1 — Data Centres Australia/DC Byte
- Digital demand surge: Preparing Australia's power systems for the rise of data centres — AEMO
- Data Center Outlook: Half of 2026 Pipeline May Not Materialize — Sightline Climate
- Hyperscale Data Center Count Hits 1,136; Average Size Increases; US Accounts for 54% of Total Capacity — Synergy Research Group
- ERCOT 410 GW Large-Load Queue: What Is Real, What SB 6 Filters — KilowattLogic
- Data center grid-power demand to rise 22% in 2025, nearly triple by 2030 — S&P Global/451 Research
- 2026 Data Center Power Report — Bloom Energy
- Canadian data center market to see exponential growth, pipeline almost 9GW — DataCenterDynamics/DC Byte
- AESO Update on Data Centres — Alberta Electric System Operator
- Setor de data centers bate recorde em 2025 e reforca hubs regionais na America Latina — DataCenterDynamics/JLL
- Brasil Lidera Expansao de Data Centers na America Latina na Corrida Global por IA — Forbes Brasil/JLL
- Chile hosts 15% of all data centers in Latin America — InvestChile/JLL
- Johor tops Malaysia's leading data centre hub — New Straits Times/JLL Malaysia
- Korea data center power demand to surpass 1.5 GW in three years — ETNews/KDCC
- Investors — American Electric Power
- March 2026 Investor Meetings — American Electric Power
- Data Centres Global Forecast Report 2025 — Knight Frank
- Data center availability crisis deepens as vacancy hits historic low — JLL
- Data center sector enters hyperdrive as Texas prepares to dethrone Virginia as global leader — JLL
- Long-Term Load Forecast Update 2025-2031 and Methodology Changes — ERCOT
- Powering the digital economy: The global expansion of data centres and its energy implications — CEPR/VoxEU
- Asia Pacific's Data Centre Development Pipeline Hits Record 19.4GW in 2025 — Cushman & Wakefield
- Oncor Reports First Quarter 2026 Results — Oncor
- Integrated Resource Plan — Georgia Power
- Quarterly Large Load Economic Development Report Q1 2026 — Georgia Power / Georgia PSC
- EMEA Data Centres Report October 2025 — Knight Frank
- Data Centres: The Leading Questions — Knight Frank
- Ooredoo's Syntys acquires two data centers in Qatar — DataCenterDynamics
- Gulf Economic Update: The Gulf's Digital Transformation — World Bank
- 2024 Annual Report — Bahrain Economic Development Board
- Bahrain AI Data Center Intelligence Report — AI Data Center Index
- Data Centres in Africa 2026: The Economic Report — African Data Centres Association
- South Africa's Digital Infrastructure Investment Study 2025 — Development Bank of Southern Africa
- Nigeria Data Center Market Briefing — D4D Hub / Xalam Analytics
- Powering Intelligence: Analyzing Artificial Intelligence and Data Center Energy Consumption — EPRI
- Powering Intelligence 2026 State-Level Data Center Power Data — EPRI
- Saudi Arabia Ranks Second Globally in Data Center Market Attractiveness — Saudi Press Agency
- Saudi Vision 2030 - HUMAIN — Saudi Vision 2030
- Asia Pacific Data Centre Boom to Continue in 2026 — CBRE
- Impress Data Center Survey Report 2026 release — Cloud Watch / Impress Research Institute